*** UPDATE 1/25/10 12:15pm***
After looking over some data, I have several things to talk about regarding today's potential severe weather. There is a decent instability, and strong vertical wind shear. This means potential for tornadoes. The NWS has hinted that some of these could be long-tracked, if they develop. Isolated showers and thunderstorms will start to effect us within a few hours, but the biggest severe weather threat looks to be late afternoon through the evening. Damaging winds and tornadoes are the biggest threat today, although I won't rule out some hail.
As we move into the evening hours, look for a aquall line to develop, and move across the area. This line of thunderstorms could have embedded supercells, and will probably bow out in some spots. We will also see locally heavy rainfall between 1 to 3 inches, something that could potentially create flash flooding.
******************************************************************************
Severe weather is possible across Central Florida tomorrow.
A low pressure system is developing in the Gulf of Mexico, and will track through South Georgia tomorrow and tomorrow night. The Storm Prediction Center has Florida in a Slight Risk area for severe weather. Deep moisture levels and strong upper level winds will combine with decent atmospheric instability to create conditions that will be conducive for a squall line to develop ahead of the cold front. The timeline for strongest storms looks to be late afternoon going into the evening, and overnight for some locations. The main threat tomorrow will be damaging winds, hail, and isolated tornadoes in the stronger parts of the storm. Will update in the morning to reflect any changes, and to highlight any watches/warnings.
Monday, January 24, 2011
Wednesday, January 5, 2011
Weather Radar History, and the Impact Made by the WSR-88D
I've been trying to think of something interesting to write about. I decided to write a brief history of weather radar, and the impacts made by the WSR-88D Next Generation Radar (NEXRAD) system.
First, a brief explanation of how radar works, before we go into the history of Doppler Radar.
The term "RADAR" stands for RAdio Detection And Ranging. Doppler radar works by sending out radio waves, known as pulses. When these pulses hit an object, such as a raindrop, they bounce back to the radar, and calculations are made to determine storm position. (This is a basic description of how radar works. If you want to know more, here is a link to the NWS.)
There are several types of radar products offered by the WSR-88D (go here for more info, as this is only a basic explanation):
Reflectivity, which shows storm intensity based on the amount of energy reflected back to the radar.
Velocity, which shows the motion of the target object currently in the path of the radar beam.
There are also two precipitation products. One attempts to estimate the rainfall amount expected within one hour, and the other attempts to estimate the total amount of rainfall a given storm will produce.
Now, the history.
The British were the first to develop devices that could locate thunderstorms, through the work of Sir Robert A. Watson-Watt, in 1935. From 1942 to 1944, work was done at the Massachusetts Institute of Technology's Radiation Laboratory that helped show that storms could be seen on certain types of radar systems, and at different wavelengths, up to distances of 150 miles. Work continued during WWII, and through research conducted at harbor defense radar systems in Panama, many basic features of storm structure were discovered.
After WWII, the Weather Bureau was able to acquire AN/APS-2F aircraft radar systems from the U.S. Navy. These were renamed Weather Surveillance Radars with designations ranging from 1, 1A, 3, 4, and deployed slowly, with around five per year coming into operational use. The first WSR was deployed on March 12th, 1947 in Washington, D.C. A second WSR was deployed in Wichita, Kansas on June 1st. Eventually, radar systems were being made specifically for use by the Weather Bureau. These were known as AN/CPS-9 Storm Detection Radars. In the 1950s, more advancements in radar technology were made, and in 1953, hook echoes (a feature seen on radar that indicates a tornado) were first seen on a radar in Illinois.
Fast forward to 1990: A new WSR system is implemented in Norman, Oklahoma. This new Next Generation Radar (NEXRAD) system, the Weather Surveillance Radar 1988 Doppler, was the result of many years worth of advancements made in radar technology. These Next-Gen systems are currently deployed at every National Weather Service office nation-wide, as well as many military installations.
First, a brief explanation of how radar works, before we go into the history of Doppler Radar.
The term "RADAR" stands for RAdio Detection And Ranging. Doppler radar works by sending out radio waves, known as pulses. When these pulses hit an object, such as a raindrop, they bounce back to the radar, and calculations are made to determine storm position. (This is a basic description of how radar works. If you want to know more, here is a link to the NWS.)
Velocity, which shows the motion of the target object currently in the path of the radar beam.
There are also two precipitation products. One attempts to estimate the rainfall amount expected within one hour, and the other attempts to estimate the total amount of rainfall a given storm will produce.
Now, the history.
The British were the first to develop devices that could locate thunderstorms, through the work of Sir Robert A. Watson-Watt, in 1935. From 1942 to 1944, work was done at the Massachusetts Institute of Technology's Radiation Laboratory that helped show that storms could be seen on certain types of radar systems, and at different wavelengths, up to distances of 150 miles. Work continued during WWII, and through research conducted at harbor defense radar systems in Panama, many basic features of storm structure were discovered.
After WWII, the Weather Bureau was able to acquire AN/APS-2F aircraft radar systems from the U.S. Navy. These were renamed Weather Surveillance Radars with designations ranging from 1, 1A, 3, 4, and deployed slowly, with around five per year coming into operational use. The first WSR was deployed on March 12th, 1947 in Washington, D.C. A second WSR was deployed in Wichita, Kansas on June 1st. Eventually, radar systems were being made specifically for use by the Weather Bureau. These were known as AN/CPS-9 Storm Detection Radars. In the 1950s, more advancements in radar technology were made, and in 1953, hook echoes (a feature seen on radar that indicates a tornado) were first seen on a radar in Illinois.
Fast forward to 1990: A new WSR system is implemented in Norman, Oklahoma. This new Next Generation Radar (NEXRAD) system, the Weather Surveillance Radar 1988 Doppler, was the result of many years worth of advancements made in radar technology. These Next-Gen systems are currently deployed at every National Weather Service office nation-wide, as well as many military installations.
Currently, plans are being made for even more advancements. The National Severe Storms Laboratory (NSSL) is working on phased-array radar systems. WSR-88D radar transmits one beam of energy, then has to wait for the pulse to return before going to the next elevation angle. When it has finished scanning every angle it starts the process over. By this time, six to seven minutes have passed, and in that time, the storm could be over, or have produced a tornado that was missed by radar. Phased-array radar on the other hand, sends out multiple pulses one at a time, so the radar has no need to tilt to look at the different elevation angles. This results in scanning times of about 30 seconds, which is much, much faster than what the WSR-88D is capable of. Having the ability to do a complete scan in 30 seconds will enable forecasters to see storms better, and will help to increase warning times in severe situations. Unfortunately, phased-array radar will most likely only be installed in select areas.
In closing, radar has come a very long way from the early technology of the 1940s and '50s and is constantly improving. Just imagine what we'll be looking at in 20 years.
Sunday, December 12, 2010
Extreme Weather: A Book In Review
As I've been away from this blog and haven't posted anything for the past three months (and two days, technically), I am wanting to get back to it. To ease myself back in, I'm going to write a review of an excellent book I read recently.
This book, Extreme Weather: Understanding The Science of Hurricanes, Tornadoes, Floods, Heat Waves, Snow Storms, Global Warming And Other Atmospheric Disturbances; was written by H. Michael Mogil, a professional meteorologist living in Naples, Florida. He also runs his own company, How The Weather Works.
If you are wanting to learn about weather, this is the book for you. 304 pages long, with a reference section that includes links to information related to each chapter, a glossary, and a list of recommended books for further reading. On top of all of this information it is an extremely well-written book. I have read a lot of weather-related books, and this one is the best of my collection, and that includes several college level meteorology books I've been given. Not only was it well-written, it was also very easy to understand. Several of the topics discussed are somewhat complex, but in this book they are explained in a way that is both easy and fun to read. Despite already having read about a lot of the information in the book, I found that I could not put it down and was highly disappointed when I had finished it.
Even if you've read weather books before, you haven't read one like this. I highly recommend it to anyone interested in weather, regardless of their knowledge level. Extreme Weather is not a one-stop shop, as it doesn't cover everything weather-related, but it does exactly what it was intended to do in providing an easy, fun to read resource for those interested in weather.
The topics covered include tornadoes, heat waves, floods, snow storms, and global warming. Each topic has around 30 pages devoted to it. In those approximately 30 pages, there is just about everything you need to know about the subject matter (at a basic to intermediate level). Overall, it is an amazing book that had a lot of time and effort put into it. The result is a phenomenal piece of work that is definitely in my top ten (among my weather books, #1), and one that you are sure to enjoy.
Sunday, October 10, 2010
We don't have much longer. Pretty soon, the 2010 Atlantic Hurricane Season will be over. To date, we've had 15 named storms, with 8 hurricanes. 5 of those hurricanes were considered major (Category 3+). There is a disturbance the NHC is watching for development in the Caribbean moving west towards Nicaragua, but it doesn't look like it will amount to much.
Back here in West Central Florida, we've got nearly perfect weather. Daytime temperatures will be in the mid to upper 80s, while night-time temps will be in the 50s and 60s. Dry air will remain over the area, as high pressure moves in.
On a side note, I've just joined Foot's Forecast, a national group of high school and college students forecasting the weather. I'm the first in Florida to join. If you'd like to check them out, the main site is www.footsforecast.org, and the Florida section is on Facebook ( http://www.facebook.com/pages/Foots-Forecast-Central-Florida/164039986941236?v=wall ). The Florida page covers Central Florida, including the cities of Brooksville, Tampa/St. Petersburg, Orlando, and Kissimmee. Disney and Universal will be mentioned regularly, so if you are planning a trip to either one, be sure to check on the weather before you get there.
Tuesday, September 21, 2010
A Look Into The Future....
Well, here we are. Let's take a look into the meteorological crystal ball....
The first day of autumn (or fall, depending on what you call it) is tomorrow. Usually, as we head into October and November, temperatures cool down and in some places get downright frigid. Unfortunately, the key term here is usually. Climatologically speaking, we have had one of our hottest years on record in the U.S. and that trend looks like it will continue through the rest of the year. 2010 has already tied 1998 for hottest global year on record, and will most likely surpass 1998 as we wrap the year up.
We have had record SSTs as well, which has contributed greatly to hurricane formation in the Atlantic this hurricane season. You've probably noticed how quickly things have intensified, and how we've had several storms stronger than usual in places where they normally aren't.
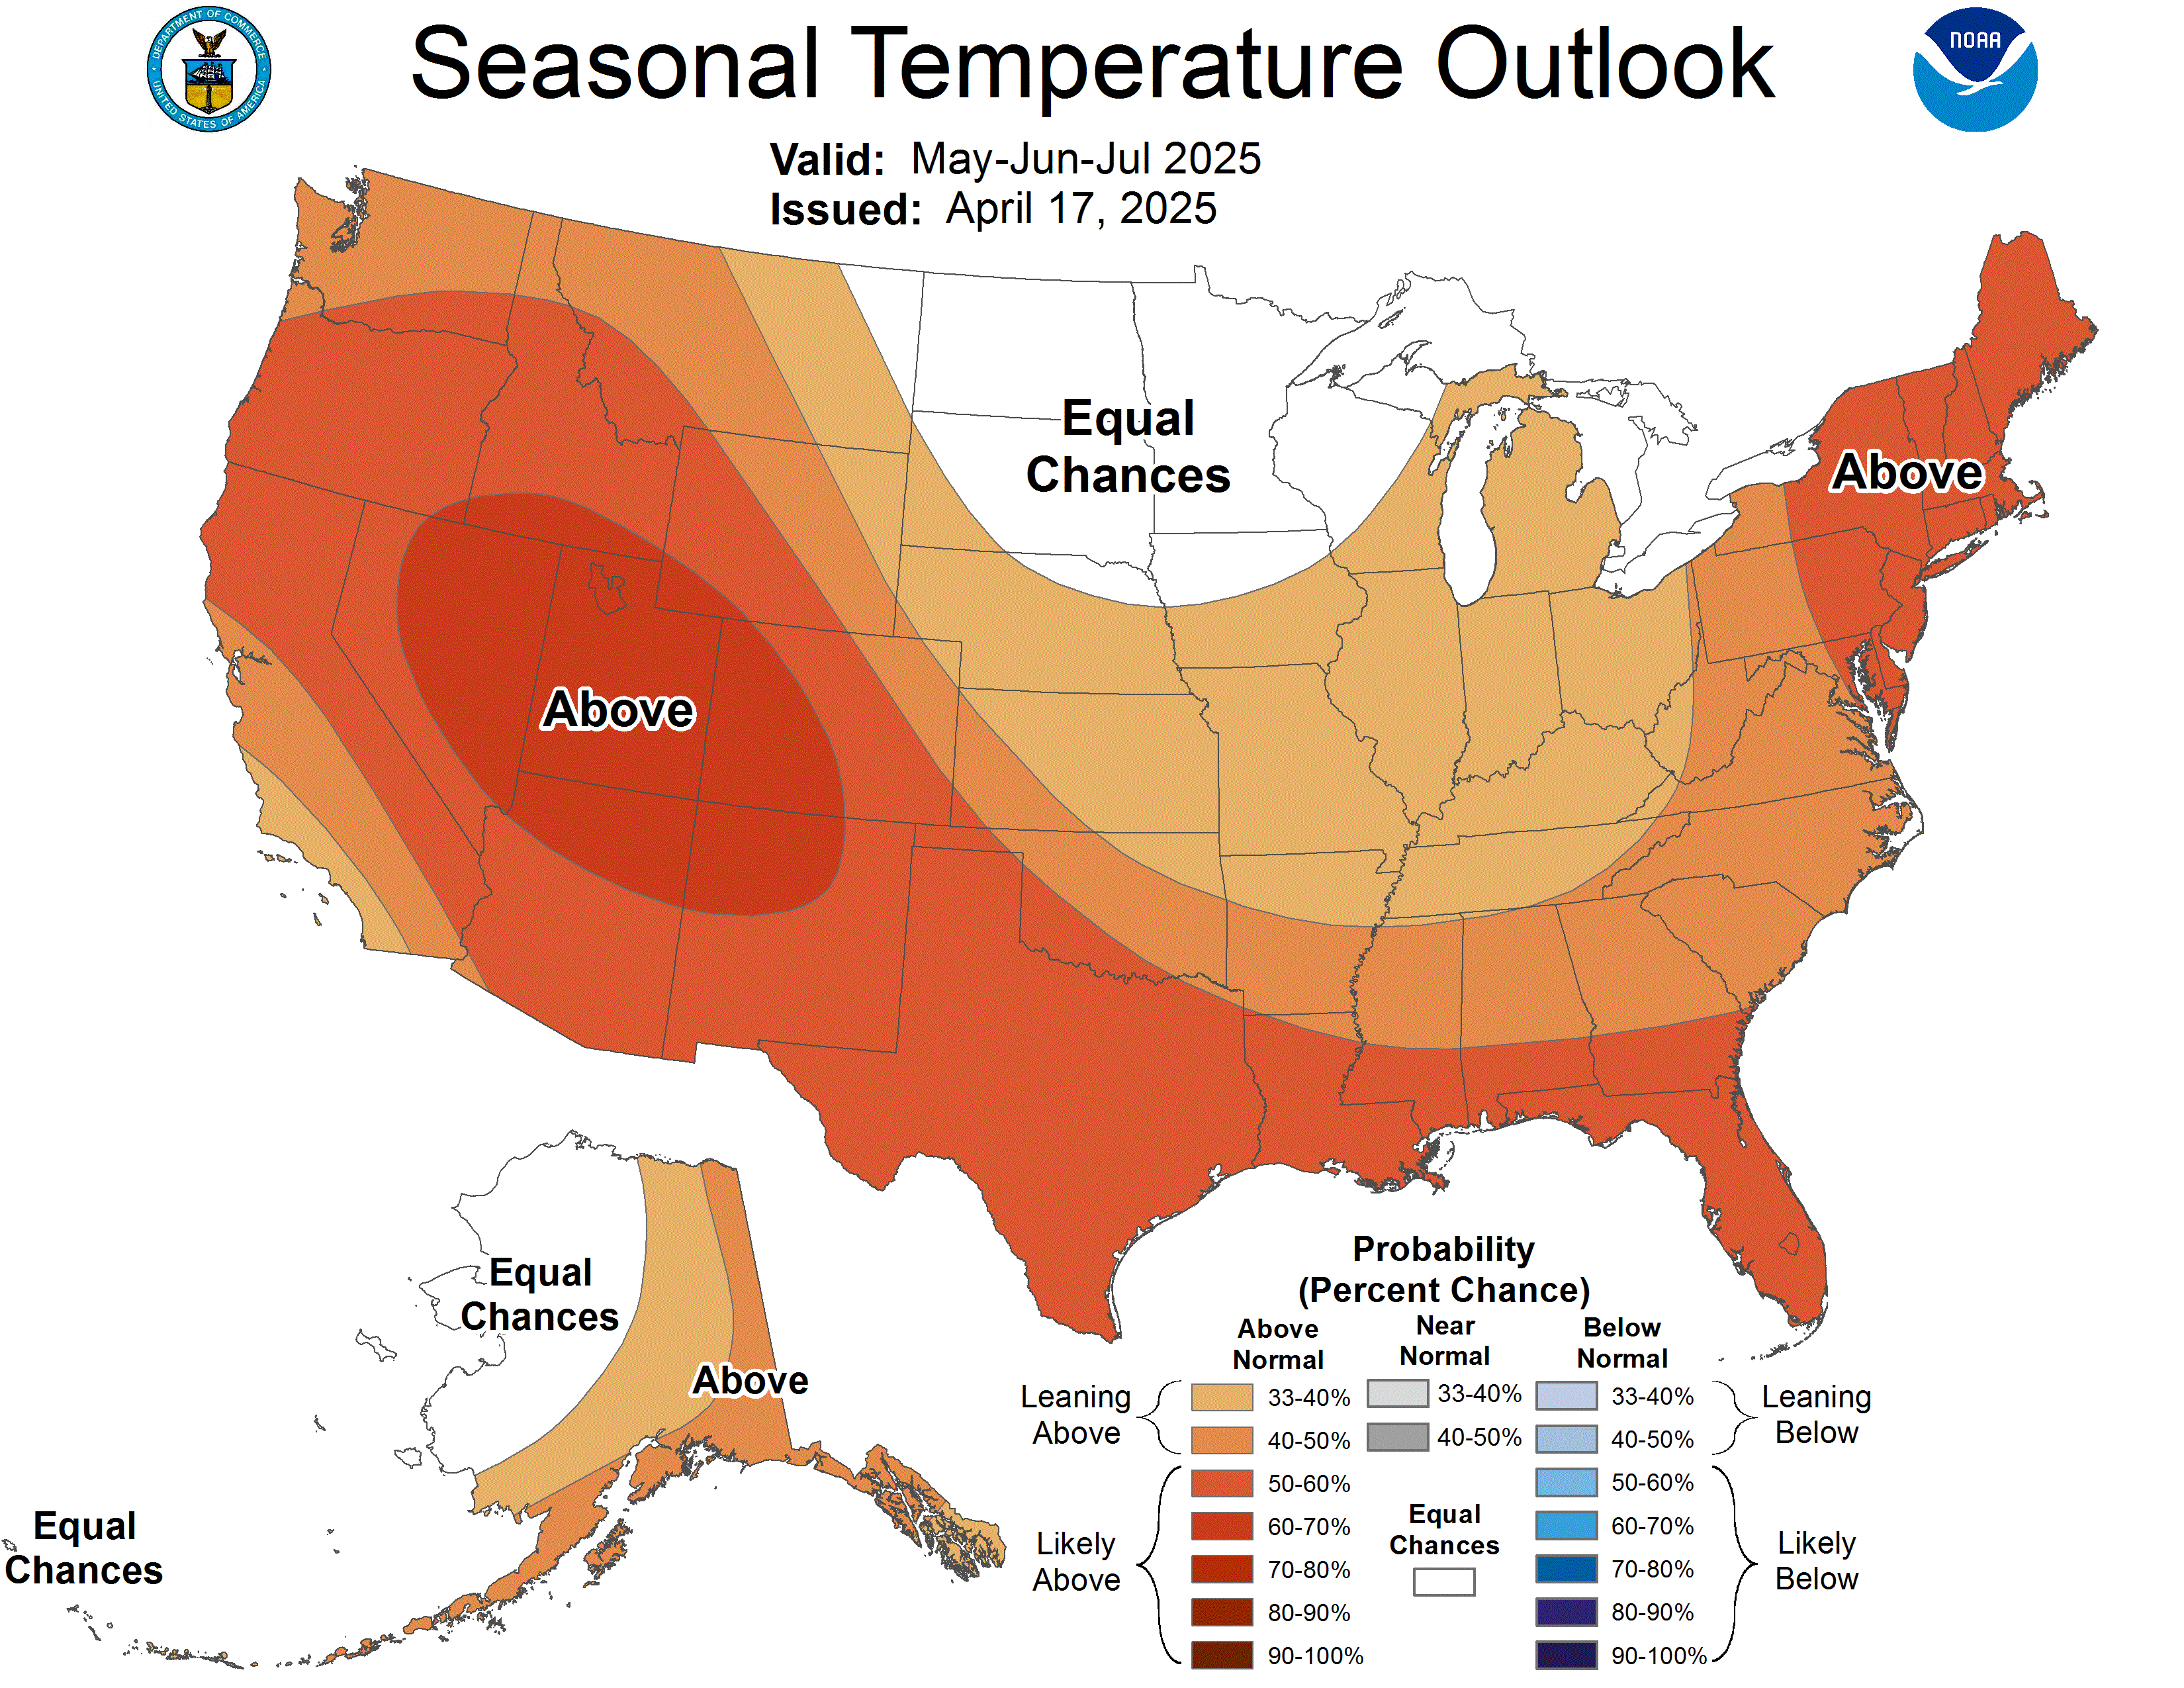
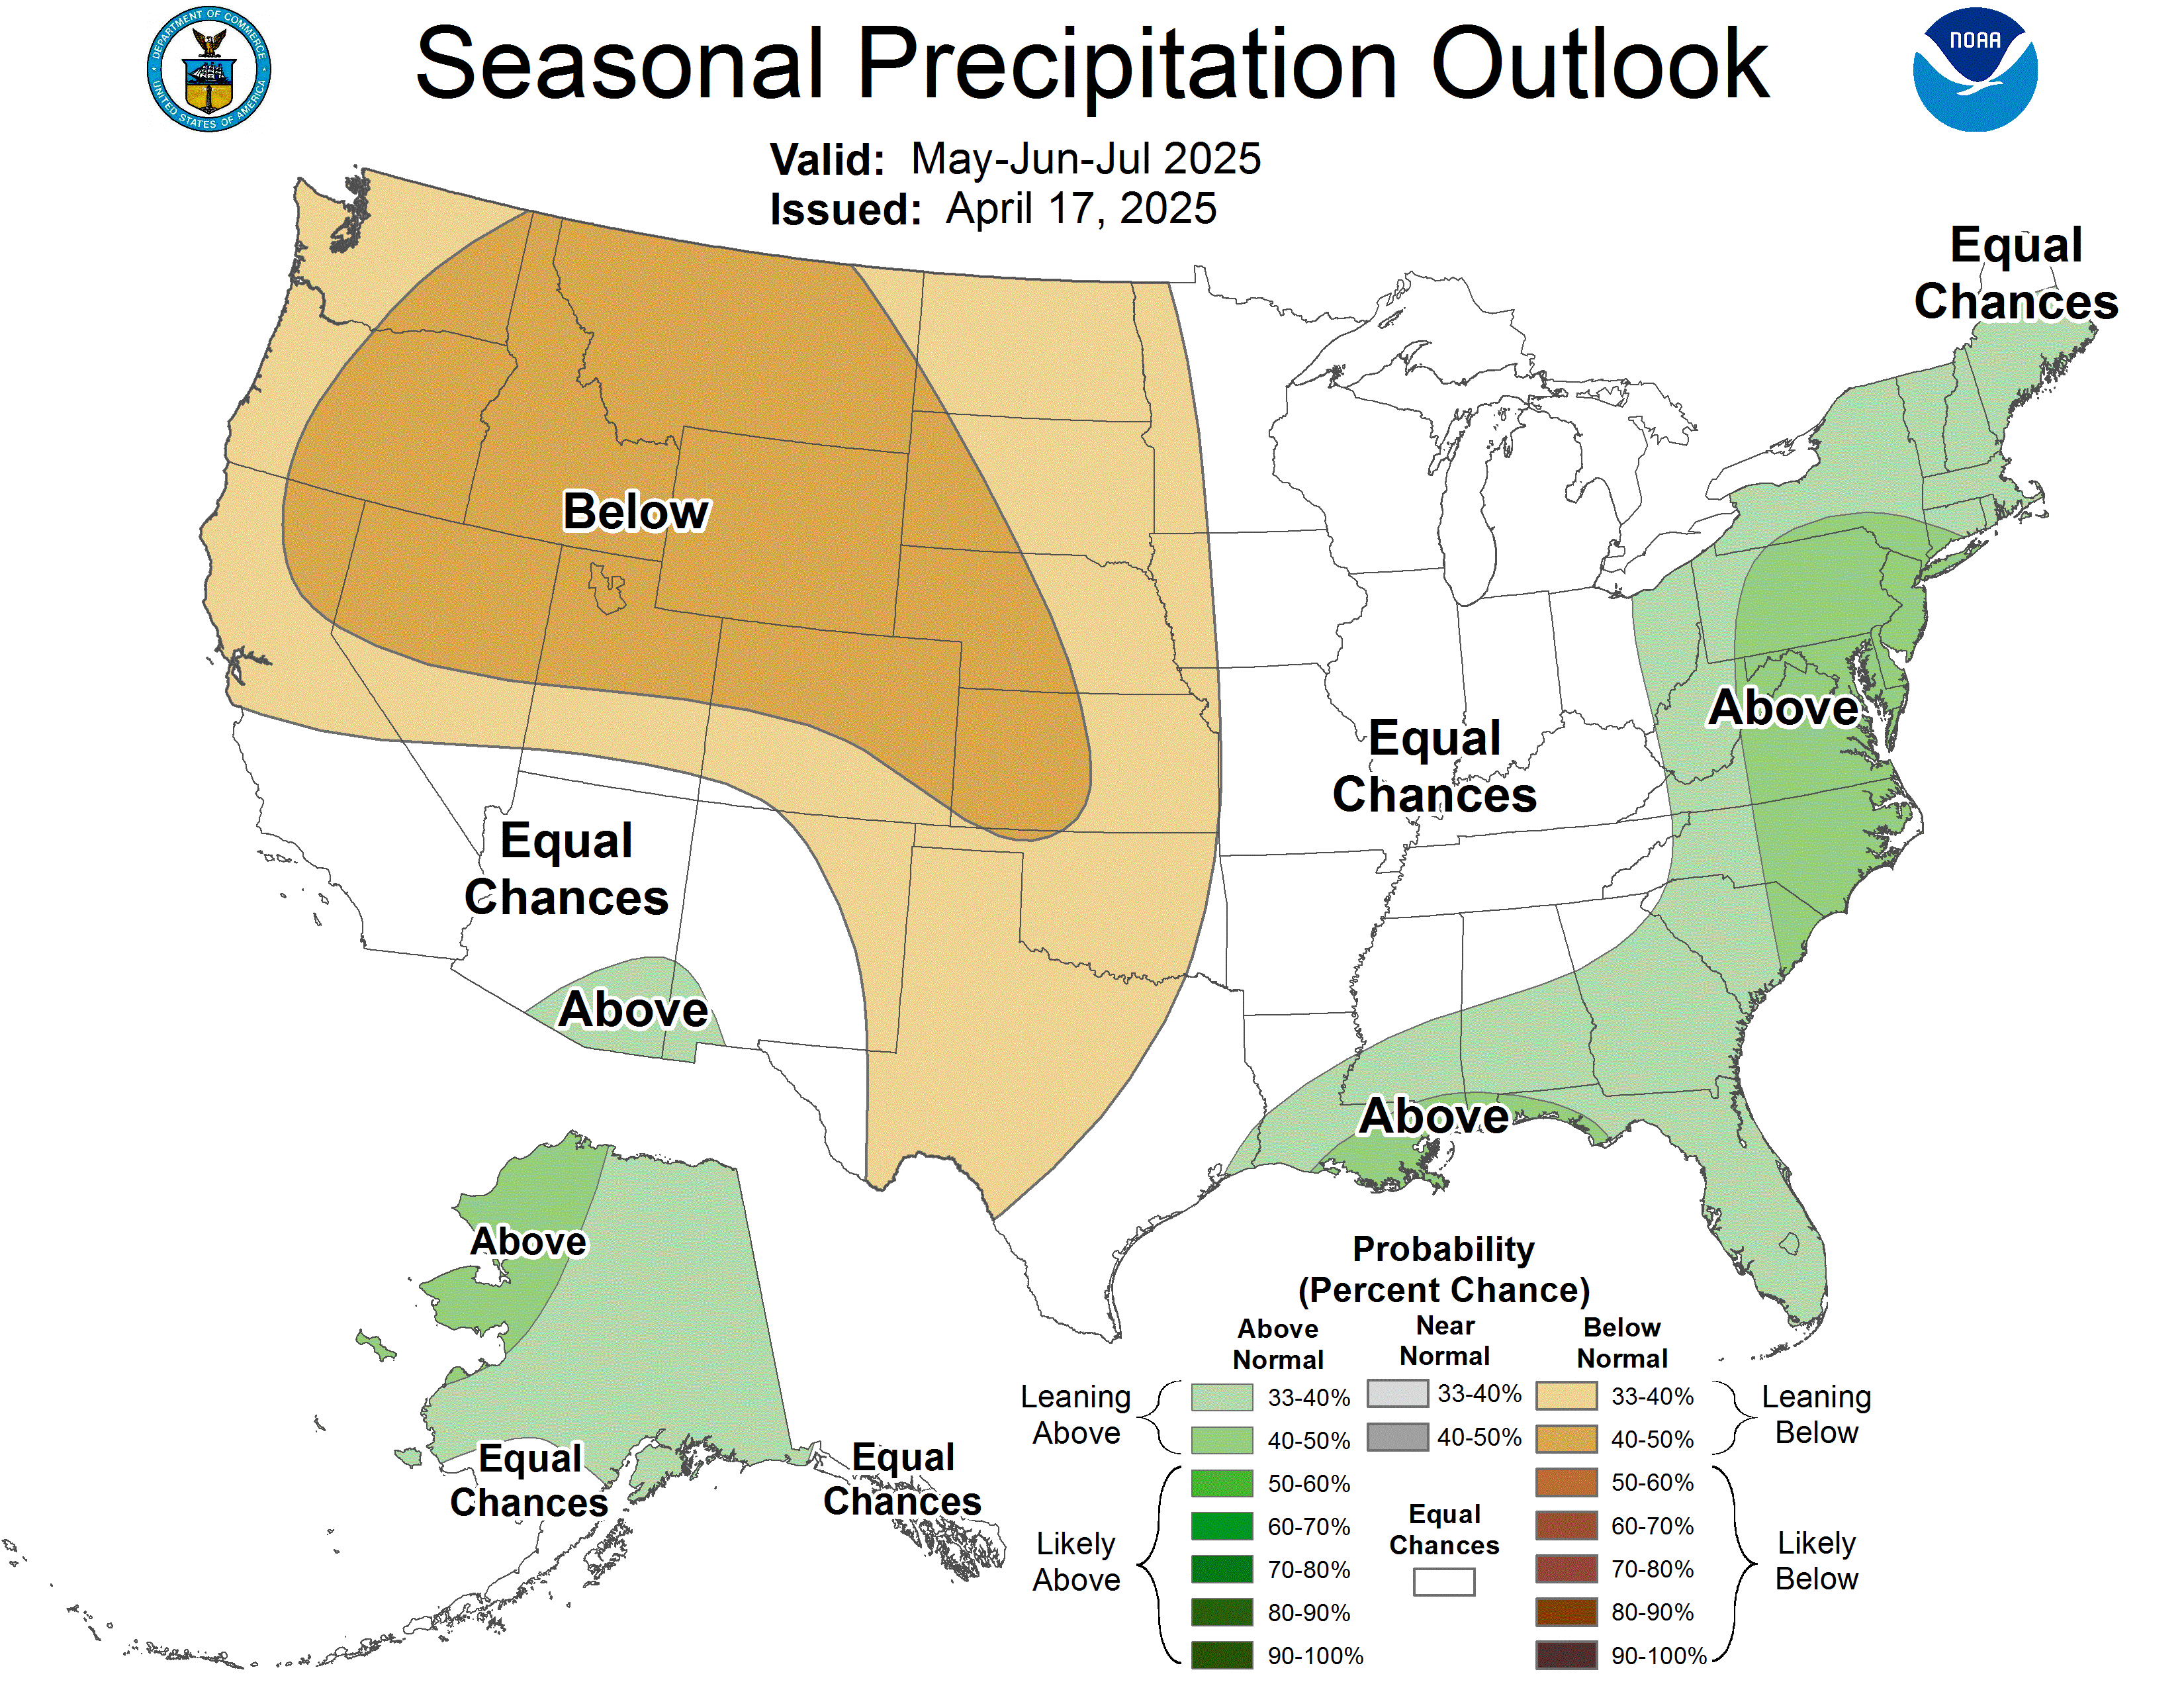
Getting back to our topic, here is the current outlook for temperature and precipitation probabilities in the U.S. for the period from October through December:
Temps:
http://www.cpc.ncep.noaa.gov/products/predictions/long_range/lead01/off01_temp.gif
Precip:
http://www.cpc.ncep.noaa.gov/products/predictions/long_range/lead01/off01_prcp.gif
Sunday, August 15, 2010
Slow Start To Atlantic Hurricane Season 2010 & Climatology Of Hurricanes
I don't know how much all of you have been watching the Atlantic this year. For all I know, you don't care at all. Regardless of whether or not you care, almost all of the major meteorological agencies and companies (NOAA, Accuweather, Dr. Gray at Colorado State, etc.) are forecasting a major hurricane season this year in the Atlantic. After you see NOAA's "updated" forecast below (with a decrease in the number of storms by three), you'll realize just what I'm talking about when I say we've had a slow start.
NOAA's updated forecast, including Alex, Bonnie, and Colin: 14 to 20 Named Storms (top winds of 39 mph or higher), including: 8 to 12 Hurricanes (top winds of 74 mph or higher), of which: 4 to 6 could be Major Hurricanes (Category 3, 4 or 5; winds of at least 111 mph)
So far, we have had one hurricane (Alex), two tropical storms (Bonnie and Colin), and two depressions (#2 and #5, the remnants of which might re-enter the Gulf of Mexico in the next few days and possibly develop into a tropical storm). Being that we are having record SST (sea surface temperature) measurements in both the Atlantic and Gulf, as well as low wind shear that is partly because of La Nina developing in the Pacific (not to mention comparisons to the 2005 hurricane season, when we had a record 28 named storms), we should be far into the list of hurricanes, right?
Not necessarily, although I won't try to explain the complexities of hurricane formation, as that is not at my current level of knowledge.
What I will do is talk about the climatology of hurricane formation, and when we are most likely to see an increase in their formation. First, the definition of the word "climate": Climate is the weather over a period of time. NOAA considers a time frame of 30 years to be a valid starting point for climate.
When talking about hurricane climatology, meteorologists tend to concentrate on the period of 1950-present. 1950 was when we started to make advancements in weather forecasting, although the most advancement started in the 1970s (mostly after the 1974 tornado "Super Outbreak", as the National Weather Service realized they were highly unprepared for such an event).
The Atlantic hurricane season starts June 1st, and ends November 30th. We generally don't see any activity in June, with an average of one storm every two years in July. August is when the season starts to ramp up, as SST gets higher and other factors come into play. September is actually the busiest month for formation, usually peaking around September 10th, after which activity tends to wind down, although we have a small jump in mid-October. After that, all activity pretty much stops. However, we have had a few storms in November, as we did in 2005.
Here is the information I have just given you in an image, and here is a map of the hurricanes to make landfall in the U.S. since 1950 (as of 2009). As a side note, we have had 85 hurricanes that have directly affected Florida since 1990.
Friday, August 13, 2010
Six Year Anniversary Of Hurricane Charley
Not only is today Friday the 13th, it is also the 6 year anniversary of Hurricane Charley making landfall in Punta Gorda, Florida. I have an analysis of Charley that I wrote for my new site, but since it's not online yet, I can't link to it. I've copied it here.
Charley was the third named storm of the Atlantic Hurricane Season in 2004, becoming the strongest hurricane at the time to make landfall in the United States.
Charley started out as a tropical wave that formed off Africa on August 4th. 2004. After moving across Cuba on the 13th and causing four deaths there, Charley rapidly accelerated and turned towards the northeast on a collision course for southwest Florida. Sometime around 3:45 p.m. the hurricane made landfall in Cayo Costa, Florida with maximum sustained winds at 150 miles per hour.
About an hour later, Charley moved into Punta Gorda, with winds measured at 145 miles per hour. Passing directly over Orlando between 8:20 and 9:40 p.m. on the 13th, Charley still had winds at 85 miles per hour, with gusts up to 106 miles per hour recorded at Orlando International Airport. Charley reemerged into the Atlantic ocean near Daytona Beach as a Category 1 hurricane and restrengthened slightly when it reached warmer water. Continuing to move rapidly to the north-northeast, Charley again made landfall near Cape Romain, South Carolina as an 80 mph hurricane, after which it moved offshore briefly, and made its final landfall near North Myrtle Beach as a minimal hurricane, with winds of 75 mph.
Charley then began interacting with an approaching frontal boundary, becoming a tropical storm over southeastern South Carolina. After moving back into the Atlantic Ocean near Virginia Beach on August 15, Charley became extratropical and became embedded in the frontal zone. As an extratropical storm, Charley continued to move rapidly to the northeast, and was completely absorbed by the front shortly after sunrise on August 15, near southeastern Massachusetts.
Here are some interesting facts about Charley:
Property damage was estimated at $5.4 billion dollars (2004 USD), and approximately $285 million dollars (2004 USD) in agricultural damage.
Charley produced a storm tide that was unofficially measured to up to 7.19 ft. in Myrtle Beach.
Hurricane Charley was the 19th strongest tropical cyclone to make landfall in the United States.
The unofficial storm tide (storm surge plus the tide) was estimated to be 6.5 ft. at the barrier islands near Punta Gorda.
Here is a radar loop of Hurricane Charley's trek through Florida. To quote Dan Noah, WCM at NWS Tampa, "Hurricane Charley acted like a ten mile wide F2 tornado".
Subscribe to:
Posts (Atom)